【chart.js】グラフを4分割して、任意のグラフを作り直して再表示させる【myChart.destroy()】
- 作成日時:
- 最終更新日時:
- Categories: フロントサイド
- Tags: chart.js JavaScript ウェブデザイン

ソースコード
HTML
<!DOCTYPE html>
<html lang="ja">
<head>
    <meta charset="UTF-8">
    <meta name="viewport" content="width=device-width,initial-scale=1">
    <title>Hello World test!!</title>

    <script src="https://code.jquery.com/jquery-3.6.0.min.js"></script>

    <script src="https://cdn.jsdelivr.net/npm/chart.js@3.6.2/dist/chart.min.js"></script>
    <script src="script.js"></script>

<style>
body{
    margin:0;
}
</style>
</head>
<body>

    <section style="width:90%;margin:auto;">

        <div style="display:flex;">
            <div style="position:relative;width:50%;">
                <canvas id="graph1"></canvas>
            </div>
            <div style="position:relative;width:50%;">
                <canvas id="graph2"></canvas>
            </div>
        </div>
        <div style="display:flex;">
            <div style="position:relative;width:50%;">
                <canvas id="graph3"></canvas>
            </div>
            <div style="position:relative;width:50%;">
                <canvas id="graph4"></canvas>
            </div>
        </div>

    </section>

</body>
</html>
JavaScript
window.addEventListener("load" , function (){
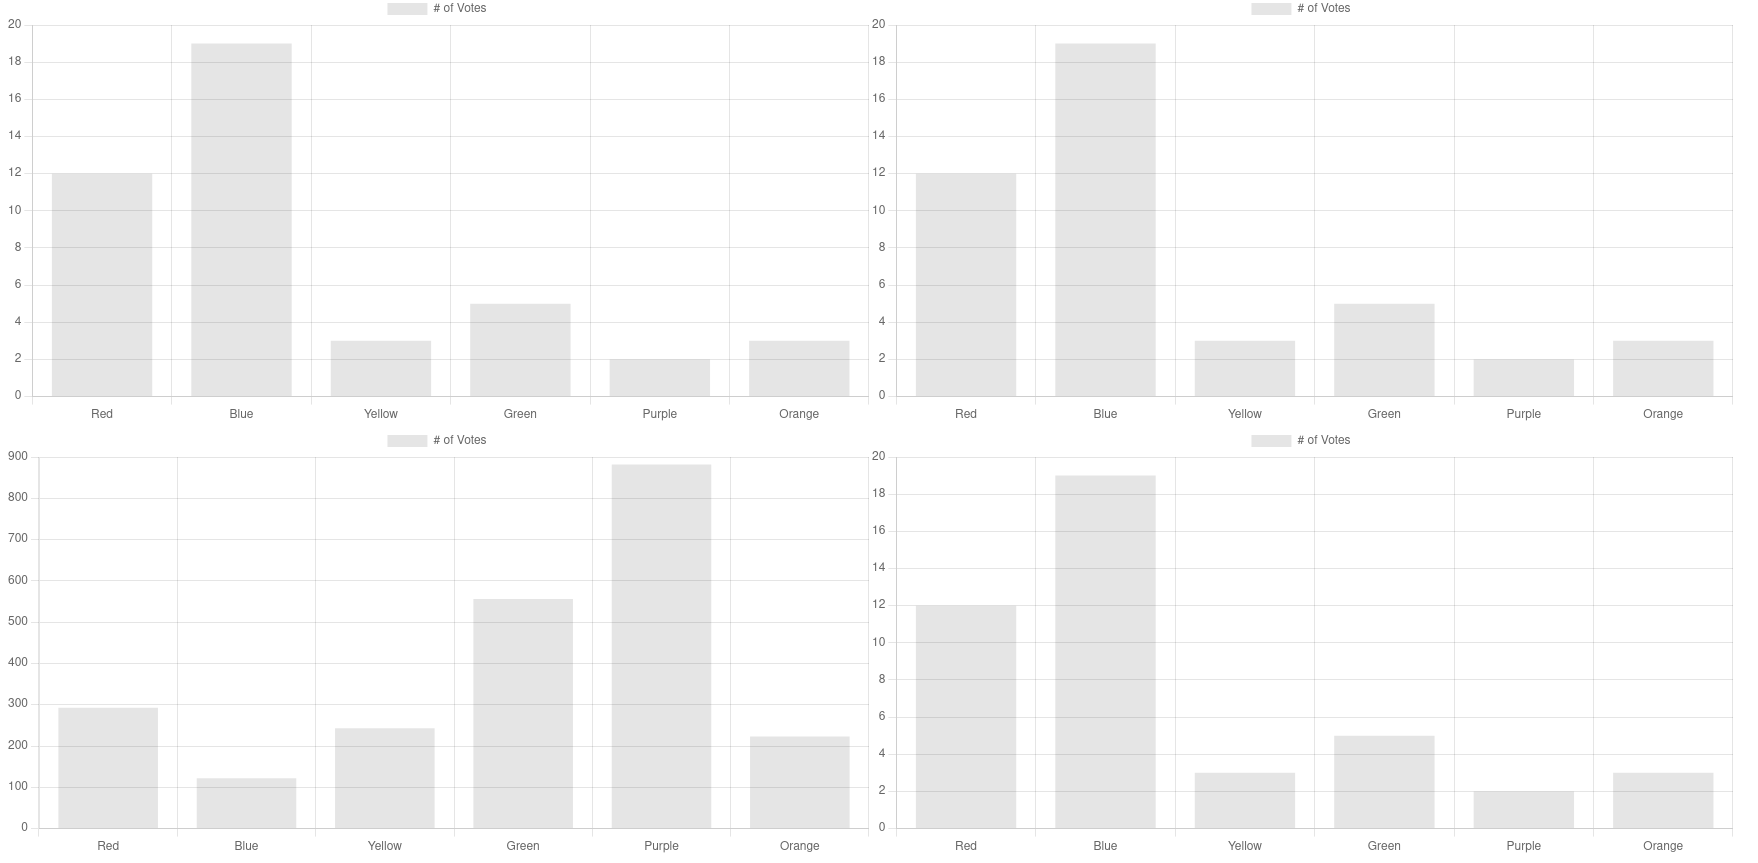
let id_list = [ "graph1","graph2","graph3","graph4" ];
for (let id of id_list){
const ctx = document.getElementById(id).getContext('2d');
const myChart = new Chart(ctx, {
type: 'bar',
data: {
labels: ['Red', 'Blue', 'Yellow', 'Green', 'Purple', 'Orange'],
datasets: [{
label: '# of Votes',
data: [12, 19, 3, 5, 2, 3],
}]
},
options: {
scales: {
y: {
beginAtZero: true
}
}
}
});
if (id === "graph3"){
//予め作ったグラフをデストロイする。
myChart.destroy();
//その上で既に作られたグラフに後からデータを入れてみる。(mychartはconstなので、代入はできない。新しい定数に格納する。)
const destroyed_myChart = new Chart(ctx, {
type: 'bar',
data: {
labels: ['Red', 'Blue', 'Yellow', 'Green', 'Purple', 'Orange'],
datasets: [{
label: '# of Votes',
data: [293, 122, 243, 556, 882, 223],
}]
},
options: {
scales: {
y: {
beginAtZero: true
}
}
}
});
}
}
});
動かすとこうなる。
結論
このように、グラフを非表示にさせたり、再描画させたりすることも可能なので、例えば、グラフに表示させるデータを選び、再度表示させることも可能だ。
他にも、Ajaxでポーリングを行い、データの更新と同時にグラフを再描画させることで、リアルタイムでグラフを描画できるのでは?と考えている。
一定時間おきにAjaxを使って、資産価値を計算する。円グラフで資産価値の割合を表示させたり、1時間おきの資産の変動を棒グラフで表現できれば、面白いだろうなと。