【Django】年、月、日単位でデータをファイリングする時はTruncを使用する【月ごとの売上、個数などの出力に有効】

ブログなどでよくある、月別アーカイブ。経理でよくある、月ごとの売上記録、年ごとの収支。そういった計算をする時、annotateとTruncを使えば1行で出力できる。
ソースコード
モデルがこんな感じ。
from django.db import models

class Menu(models.Model):

    class Meta:
        db_table = "menu"

    name    = models.CharField(verbose_name="メニュー名",max_length=2000)
    date    = models.DateField(verbose_name="売り上げた日")
    amount  = models.IntegerField(verbose_name="売上金")

    def __str__(self):
        return self.name
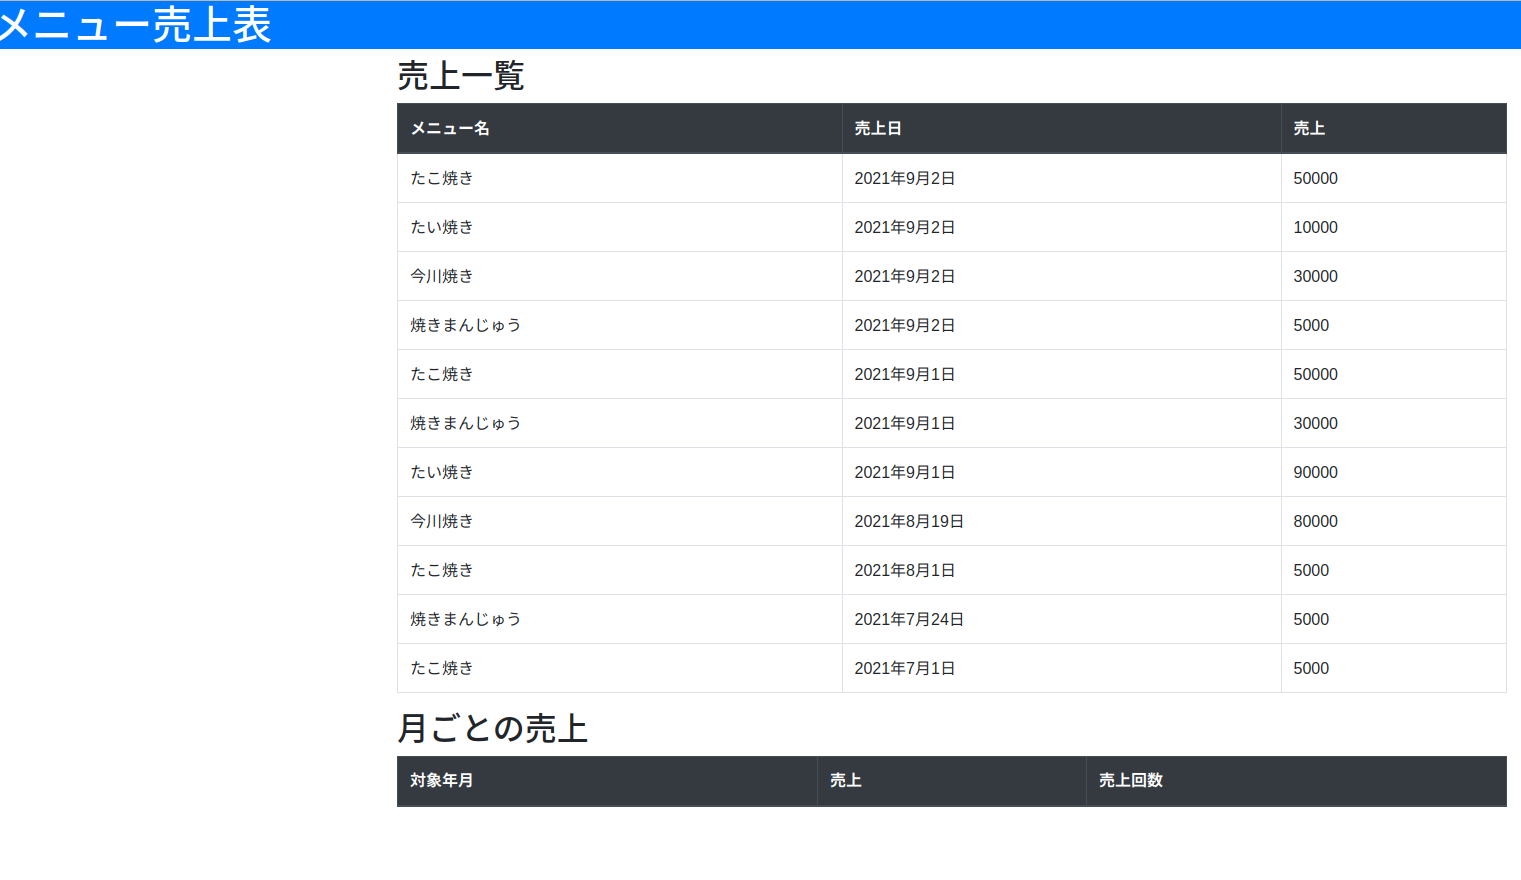
データを入力して表示させるとこんな感じ。急造したためモデルとテーブルのヘッダ名がややおかしいが、要するにメニュー名と売上日と売上金が書かれてある。
それを、月ごとに売上金と売上回数を合計して表示させたい。

ビューはこうなる。
from django.shortcuts import render,redirect

from django.views import View
from .models import Menu

from django.db.models.functions import TruncMonth
from django.db.models import Count,Sum

class MenuView(View):

    def get(self, request, *args, **kwargs):

        menus           = Menu.objects.all().order_by("-date")
        monthly_menus  = Menu.objects.annotate(monthly_date=TruncMonth("date")).values("monthly_date").annotate(
                count=Count("id"),monthly_amount=Sum("amount")).values("monthly_date","monthly_amount", "count").order_by("-monthly_date")

        context = { "menus":menus,
                    "monthly_menus":monthly_menus,
                    }

        return render(request,"menu/index.html",context)

index   = MenuView.as_view()
まず、annotateでフィールド追加する。TruncMonthで日付フィールドを指定、月ごとにまとめてmonthly_dateとして追加。その後、Count("id")で月毎に含まれているレコードの数をカウント、月ごとに売上金(amount)を合計し、それぞれcount、monthly_amountとしてannotateで追加する。
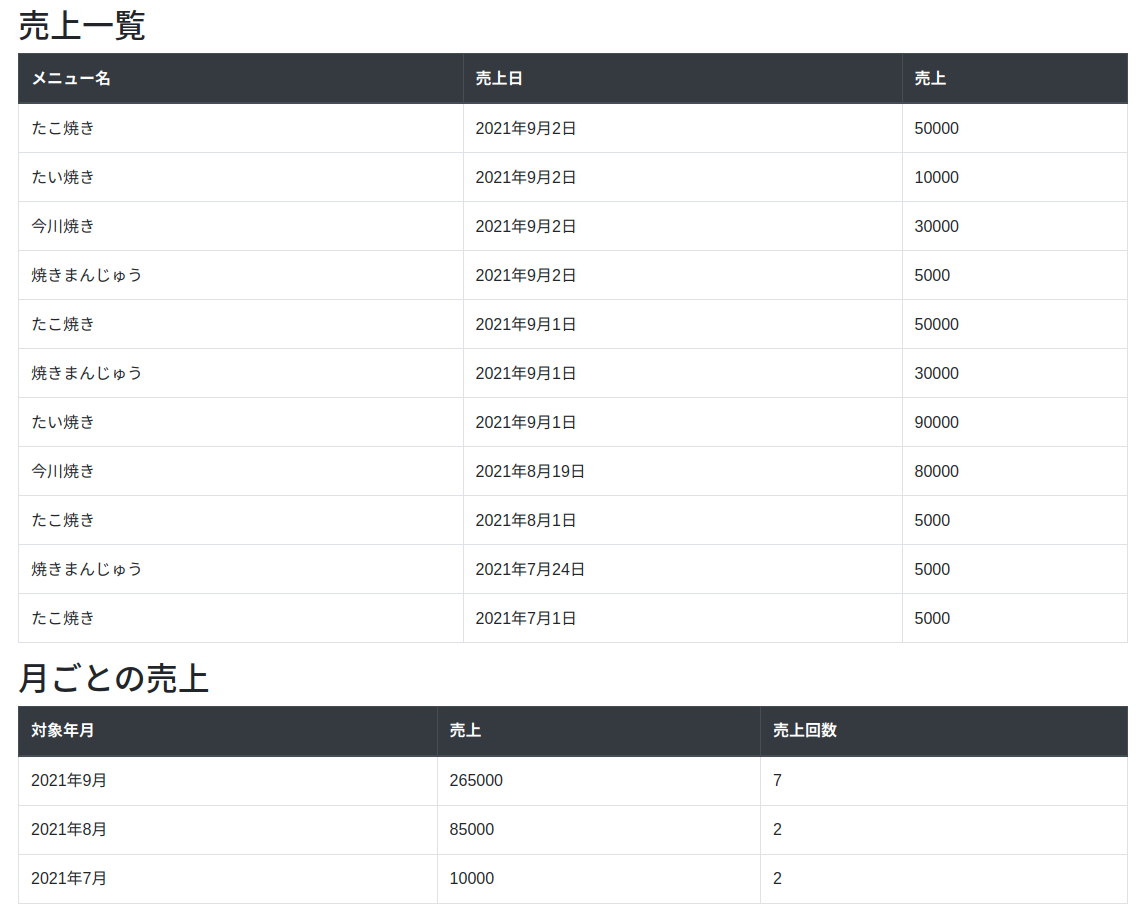
最後に、monthly_dateで並び替えを最新順に仕立てる。これで、月ごとの売上金、売上回数を表示できる。
テンプレートはこうなる。
<!DOCTYPE html>
<html lang="ja">
<head>
	<meta charset="UTF-8">
    <meta name="viewport" content="width=device-width,initial-scale=1">
	<title>メニュー売上表</title>
    <link rel="stylesheet" href="https://stackpath.bootstrapcdn.com/bootstrap/4.4.1/css/bootstrap.min.css" integrity="sha384-Vkoo8x4CGsO3+Hhxv8T/Q5PaXtkKtu6ug5TOeNV6gBiFeWPGFN9MuhOf23Q9Ifjh" crossorigin="anonymous">
</head>
<body>

    <h1 class="bg-primary text-white">メニュー売上表</h1>

    <main class="container">

        <h2>売上一覧</h2>

        <table class="table table-bordered">
            <thead class="thead-dark">
                <tr>
                    <th>メニュー名</th>
                    <th>売上日</th>
                    <th>売上</th>
                </tr>
            </thead>
            <tbody>
                {% for menu in menus %}
                <tr>
                    <td>{{ menu.name }}</td>
                    <td>{{ menu.date }}</td>
                    <td>{{ menu.amount }}</td>
                </tr>
                {% endfor %}
            </tbody>
        </table>

        <h2>月ごとの売上</h2>

        <table class="table table-bordered">
            <thead class="thead-dark">
                <tr>
                    <th>対象年月</th>
                    <th>売上</th>
                    <th>売上回数</th>
                </tr>
            </thead>
            <tbody>
                {% for m in monthly_menus %}
                <tr>
                    <td>{{ m.monthly_date|date:"Y年n月" }}</td>
                    <td>{{ m.monthly_amount }}</td>
                    <td>{{ m.count }}</td>
                </tr>
                {% endfor %}
            </tbody>
        </table>

    </main>
</body>
</html>
動かすとこうなる

他にも売上の平均額などを算出したいのであれば、Avgを使うと良いだろう。そのままだと年月だけでなく日付(1日)まで表示するので、テンプレートで表示させたくない場合は、dateフィルタを使うと良い。
結論
これで月ごとの個数を計測し表示させることができる。もっとも最古と最新のデータを元に1月ずつずらしてループし.count()すれば実現出来なくもないが、コードが長くなる。
モデルのfunctionsは他にも関数があるようなので、覚えておけばビューの処理が大幅に軽減できそう。
問題点として.values()を使うので、モデルオブジェクトではなく辞書型になってしまうこと。外部キーで繋がっているデータをテンプレート側で参照したい場合、この方法では参照するデータを追加する必要がある。
https://stackoverflow.com/questions/8746014/django-group-by-date-day-month-year
https://docs.djangoproject.com/en/3.2/ref/models/database-functions/#trunc